Wetlands, ranging from bogs and marshes to wooded swamps, are distinct ecosystems that define the natural landscape of Tennessee. They are vital to the state’s ecological well-being and scenic charm—and they yield crucial benefits to society, including filtering pollutants, recharging aquifers and streams, and providing flood storage capacity.
“Our state has a very special geology and ecology that my agency believes is worthy of protecting,” shared April Grippo, director of the Division of Water Resources at the Tennessee Department of Environment and Conservation (TDEC).
Protecting and managing wetlands falls on TDEC, and this mission is carried out by the Division of Water Resources. In response to recent changes in federal wetland protection laws, TDEC staff now have access to an innovative tool that uses GIS technology to solve an old problem: locating all the potential wetlands in the state.
Using deep learning models, including Esri’s Wetland Identification Model, Esri partner Skytec developed a wetlands predictive model that located 800,000 additional acres of wetlands in Tennessee.
To address this challenge, TDEC staff, in collaboration with Esri partner Skytec, leveraged the Esri Wetland Identification Model (WIM), ArcGIS Online, and ArcGIS Experience Builder to develop a predictive model of the locations and extents of existing and potential wetlands throughout the state. The resultant Tennessee Wetland Screening tool allows anyone—from state agencies and policymakers to farmers, landowners, and developers—to visualize wetlands across the state, enabling informed decision-making.
Understanding Tennessee’s Wetland Landscape
State agencies have traditionally relied on the National Wetlands Inventory (NWI) dataset, which is maintained by the US Fish and Wildlife Service, for wetland mapping and regulatory needs. The NWI data within Tennessee was mostly generated via imagery from the 1980s, and only pockets of it have been updated since. This led to outdated and coarse-scale wetland data.
Since US states were recently granted autonomy to define and regulate nonfederal wetlands within their borders, it has become paramount for state agencies to find ways to update their wetland data. Access to accurate and up-to-date wetland data proved particularly crucial in Tennessee as state lawmakers considered new policies regarding wetlands and the extent of the state’s regulatory authority over them in 2024 and 2025.
“Legislators, nonprofits, and members of the public were calling us, and they all wanted to know how many wetlands were in the state and where did we get that number from,” Grippo recalled. “We knew we needed better data; a statewide number; and, importantly, [to be] able to predict where they are.”
Grippo explained that to certify the existence of wetlands, a TDEC representative or qualified consultant must conduct on-site inspections. In the past, TDEC’s reliance on the NWI has led to inaccuracies in identifying potential wetlands, causing some to be undocumented. This often resulted in property developers or owners being unaware that jurisdictional wetlands were present on their property, potentially causing delays and additional costs when they later needed to mitigate for these wetlands.
This is where the statewide mapping project came in: It aimed to provide a comprehensive, up-to-date resource for policymakers and landowners alike.
TDEC approached Skytec, which specializes in developing solutions using remote sensing and geospatial artificial intelligence (GeoAI), to model wetlands and provide a better idea of their extents and locations across the state.
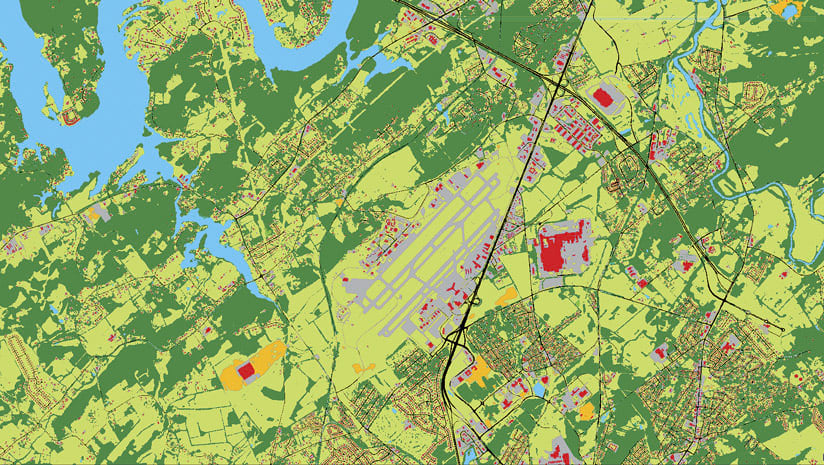
Using the deep learning model (first image) helped the Tennessee Department of Environment and Conservation (TDEC) create higher-resolution land-cover images of the entire state—including Knoxville, shown here—than was possible with the 30-meter land-cover imagery (second image) from the National Land Cover Database (NLDC).
Developing an Accurate and Transparent Tool
For TDEC, it was crucial that the wetlands data model incorporate a wide array of perspectives for various end users. The information needed to be equally valuable to lawmakers deciding on wetland legislation, regulatory agencies tasked with wetlands protection, and stakeholders such as residential and commercial developers, farmers, and conservation organizations.
The tool needed to help developers assess potential environmental impacts and avoid having to engage in wetland mitigation—the process of compensating for wetland loss by creating new wetlands or enhancing existing ones. For farmers, it needed to aid them in avoiding waterlogged areas and making strategic planning decisions. For conservationists, the model needed to support flood management and identify areas suitable for ecological restoration or the preservation of rare species, as well as locations with high biodiversity.
For stakeholders across the board, the tool needed to quickly identify and eliminate unsuitable sites, reducing the need for extensive field assessments.
“There are a lot of finances that go into purchasing property, and stakeholders want to know what their constraints are. So for this project, the goal was for more informed decision-making no matter who you were,” said Chris Fleming, a senior solutions engineer at Skytec.
Creating the model—a monumental task—required the seamless integration of technologies for which Skytec is renowned, including processing lidar data, integrating high-resolution satellite imagery, and developing advanced deep learning algorithms. Key to the model’s success was the training data. Fleming meticulously downloaded ground-truthed wetland delineations from regulatory reports dating back to 2011 and digitized them into a usable format. Subsequently, he incorporated Natural Heritage Network data on rare, threatened, or endangered element occurrences or habitat, as well as data from conservation groups, regional scientists, and remotely verified NWI data and delineation data.
“There’s a lot of people with a lot of information in their heads that’s not on a map,” explained Fleming. “That was the focus of our effort: We wanted the best possible training data.”
Additionally, because of Tennessee’s naturally diverse landscape, the model was broken into six broadly defined ecoregions, each with its own training data and separate model.
Andy Carroll, the chief technology officer at Skytec, said the timing of the project was ideal because the team had recently deployed a high-performance computing environment in the Microsoft Azure cloud. Skytec used the preconfigured ArcGIS for Microsoft Planetary Computer and deep learning models, including Esri’s Wetland Identification Model, along with a high-resolution imagery land-cover classification model, to analyze each of Tennessee’s ecological regions.
The tool can help a range of users—from policymakers and developers to farmers and landowners—visualize wetlands across the state.
The wetland and land-cover models ran nearly nonstop for a little more than eight weeks. The result was a predicted wetlands layer and a land-cover dataset at one-meter resolution that assisted in the filtering and basic classification of wetlands across the state.
This intensive process was crucial to meeting the tight eight-week deadline set by the State of Tennessee to get this information ahead of its next legislative committee meeting.
An Encompassing Model with Many Uses
While Tennessee is the first state to create a model of this magnitude, Fleming and Carroll are confident that this process can be replicated not only for wetlands but also for other natural resources, from city canopy covers to intact riparian buffers.
“This kind of project would not have been possible just a few years ago,” Carroll said. “It was just the right time, right compute, convergence of software, and training data.”
After finishing the model, the team presented it to the public through a viewing tool built using ArcGIS Experience Builder. Skytec collaborated with Esri cartographers to create the maps and symbols used in the app.
Tennessee encompasses 26.9 million acres, and the NWI had estimated 1,065,661 acres of wetlands in the state. The model has since predicted nearly 800,000 more acres of wetlands for a total of 1,802,495 acres. Looking ahead, Grippo and her team are poised to use the model to validate their discoveries in the field and craft narratives around publicly accessible wetlands, like those within state parks.
The team’s next steps include integrating the data as a mapping layer into other TDEC workflows and addressing questions such as the number of permits issued in areas under wetland mitigation proposals. Moreover, the team aims to support the growing restoration market by identifying land with the potential for restoration that can benefit both agricultural needs and natural ecosystems.
“One agency can’t alone say something is important. We need to be able to demonstrate it, and this tool helps us tell the story about our state’s wetlands,” Grippo shared. “People are passionate about protecting these resources, but they need that knowledge, and I hope this tool becomes the first place they go [to learn].”
Wetlands, ranging from bogs and marshes to wooded swamps, are distinct ecosystems that define the natural landscape of Tennessee. They are vital to the state’s ecological well-being and scenic charm—and they yield crucial benefits to society, including filtering pollutants, recharging aquifers and streams, and providing flood storage capacity.
“Our state has a very special geology and ecology that my agency believes is worthy of protecting,” shared April Grippo, director of the Division of Water Resources at the Tennessee Department of Environment and Conservation (TDEC).
Protecting and managing wetlands falls on TDEC, and this mission is carried out by the Division of Water Resources. In response to recent changes in federal wetland protection laws, TDEC staff now have access to an innovative tool that uses GIS technology to solve an old problem: locating all the potential wetlands in the state.
Using deep learning models, including Esri’s Wetland Identification Model, Esri partner Skytec developed a wetlands predictive model that located 800,000 additional acres of wetlands in Tennessee.
To address this challenge, TDEC staff, in collaboration with Esri partner Skytec, leveraged the Esri Wetland Identification Model (WIM), ArcGIS Online, and ArcGIS Experience Builder to develop a predictive model of the locations and extents of existing and potential wetlands throughout the state. The resultant Tennessee Wetland Screening tool allows anyone—from state agencies and policymakers to farmers, landowners, and developers—to visualize wetlands across the state, enabling informed decision-making.
Understanding Tennessee’s Wetland Landscape
State agencies have traditionally relied on the National Wetlands Inventory (NWI) dataset, which is maintained by the US Fish and Wildlife Service, for wetland mapping and regulatory needs. The NWI data within Tennessee was mostly generated via imagery from the 1980s, and only pockets of it have been updated since. This led to outdated and coarse-scale wetland data.
Since US states were recently granted autonomy to define and regulate nonfederal wetlands within their borders, it has become paramount for state agencies to find ways to update their wetland data. Access to accurate and up-to-date wetland data proved particularly crucial in Tennessee as state lawmakers considered new policies regarding wetlands and the extent of the state’s regulatory authority over them in 2024 and 2025.
“Legislators, nonprofits, and members of the public were calling us, and they all wanted to know how many wetlands were in the state and where did we get that number from,” Grippo recalled. “We knew we needed better data; a statewide number; and, importantly, [to be] able to predict where they are.”
Grippo explained that to certify the existence of wetlands, a TDEC representative or qualified consultant must conduct on-site inspections. In the past, TDEC’s reliance on the NWI has led to inaccuracies in identifying potential wetlands, causing some to be undocumented. This often resulted in property developers or owners being unaware that jurisdictional wetlands were present on their property, potentially causing delays and additional costs when they later needed to mitigate for these wetlands.
This is where the statewide mapping project came in: It aimed to provide a comprehensive, up-to-date resource for policymakers and landowners alike.
TDEC approached Skytec, which specializes in developing solutions using remote sensing and geospatial artificial intelligence (GeoAI), to model wetlands and provide a better idea of their extents and locations across the state.
Using the deep learning model (first image) helped the Tennessee Department of Environment and Conservation (TDEC) create higher-resolution land-cover images of the entire state—including Knoxville, shown here—than was possible with the 30-meter land-cover imagery (second image) from the National Land Cover Database (NLDC).
Developing an Accurate and Transparent Tool
For TDEC, it was crucial that the wetlands data model incorporate a wide array of perspectives for various end users. The information needed to be equally valuable to lawmakers deciding on wetland legislation, regulatory agencies tasked with wetlands protection, and stakeholders such as residential and commercial developers, farmers, and conservation organizations.
The tool needed to help developers assess potential environmental impacts and avoid having to engage in wetland mitigation—the process of compensating for wetland loss by creating new wetlands or enhancing existing ones. For farmers, it needed to aid them in avoiding waterlogged areas and making strategic planning decisions. For conservationists, the model needed to support flood management and identify areas suitable for ecological restoration or the preservation of rare species, as well as locations with high biodiversity.
For stakeholders across the board, the tool needed to quickly identify and eliminate unsuitable sites, reducing the need for extensive field assessments.
“There are a lot of finances that go into purchasing property, and stakeholders want to know what their constraints are. So for this project, the goal was for more informed decision-making no matter who you were,” said Chris Fleming, a senior solutions engineer at Skytec.
Creating the model—a monumental task—required the seamless integration of technologies for which Skytec is renowned, including processing lidar data, integrating high-resolution satellite imagery, and developing advanced deep learning algorithms. Key to the model’s success was the training data. Fleming meticulously downloaded ground-truthed wetland delineations from regulatory reports dating back to 2011 and digitized them into a usable format. Subsequently, he incorporated Natural Heritage Network data on rare, threatened, or endangered element occurrences or habitat, as well as data from conservation groups, regional scientists, and remotely verified NWI data and delineation data.
“There’s a lot of people with a lot of information in their heads that’s not on a map,” explained Fleming. “That was the focus of our effort: We wanted the best possible training data.”
Additionally, because of Tennessee’s naturally diverse landscape, the model was broken into six broadly defined ecoregions, each with its own training data and separate model.
Andy Carroll, the chief technology officer at Skytec, said the timing of the project was ideal because the team had recently deployed a high-performance computing environment in the Microsoft Azure cloud. Skytec used the preconfigured ArcGIS for Microsoft Planetary Computer and deep learning models, including Esri’s Wetland Identification Model, along with a high-resolution imagery land-cover classification model, to analyze each of Tennessee’s ecological regions.
The tool can help a range of users—from policymakers and developers to farmers and landowners—visualize wetlands across the state.
The wetland and land-cover models ran nearly nonstop for a little more than eight weeks. The result was a predicted wetlands layer and a land-cover dataset at one-meter resolution that assisted in the filtering and basic classification of wetlands across the state.
This intensive process was crucial to meeting the tight eight-week deadline set by the State of Tennessee to get this information ahead of its next legislative committee meeting.
An Encompassing Model with Many Uses
While Tennessee is the first state to create a model of this magnitude, Fleming and Carroll are confident that this process can be replicated not only for wetlands but also for other natural resources, from city canopy covers to intact riparian buffers.
“This kind of project would not have been possible just a few years ago,” Carroll said. “It was just the right time, right compute, convergence of software, and training data.”
After finishing the model, the team presented it to the public through a viewing tool built using ArcGIS Experience Builder. Skytec collaborated with Esri cartographers to create the maps and symbols used in the app.
Tennessee encompasses 26.9 million acres, and the NWI had estimated 1,065,661 acres of wetlands in the state. The model has since predicted nearly 800,000 more acres of wetlands for a total of 1,802,495 acres. Looking ahead, Grippo and her team are poised to use the model to validate their discoveries in the field and craft narratives around publicly accessible wetlands, like those within state parks.
The team’s next steps include integrating the data as a mapping layer into other TDEC workflows and addressing questions such as the number of permits issued in areas under wetland mitigation proposals. Moreover, the team aims to support the growing restoration market by identifying land with the potential for restoration that can benefit both agricultural needs and natural ecosystems.
“One agency can’t alone say something is important. We need to be able to demonstrate it, and this tool helps us tell the story about our state’s wetlands,” Grippo shared. “People are passionate about protecting these resources, but they need that knowledge, and I hope this tool becomes the first place they go [to learn].”
From the 1800s to the first half of the 20th century, passenger and freight trains along the New York, Ontario, and Western Railway (O&W) served as a great regional connector, linking New York’s Hudson Valley cities of Port Jervis and Kingston and countless communities along the way. Originally established as an industrial route to transport coal, this line traversed the region’s open fields, dense woods, and mountainous terrain, bringing people and goods to areas including the region’s famous Catskills resorts before it was discontinued in the late 1950s.
The 57-mile New York, Ontario, and Western Railway (O&W) rail and Delaware and Hudson (D&H) Canal corridor includes some sections of public-use, off-road trail.
The Delaware and Hudson (D&H) Canal—spanning 108 miles, much of it alongside the O&W line—was hand-dug by workers in the 1820s to ship coal from Pennsylvania to markets along the Hudson River and in New York City. The D&H Canal was decommissioned when the O&W line was constructed, and as transportation infrastructure in the United States evolved toward more efficient railroads and trucking, the O&W rail line was also decommissioned. It ultimately fell into disrepair, leaving a fragmented footprint through the heart of the western Hudson Valley.
In recent years, however, the Open Space Institute (OSI), a national conservation nonprofit organization, and its partners have breathed new life into the lands that were once crossed by the O&W and the D&H Canal. OSI’s Growing Greenways plan aims to create, revitalize, and link over 250 miles of greenways, trails, and abandoned rail lines to form an interconnected network of public-use, off-road recreational trails. This trail system will connect cities and people, conserve local landscapes, and create new access to green space. The former O&W and D&H corridor, which extends through three counties and dozens of towns, will serve as the backbone of the entire Growing Greenways network.
“This is an exciting project for OSI and for the entire region. We heard from the majority of people that trails are something that the community really wants to have,” said Annie Bergelin, design and capital projects manager at OSI. “But for this project to succeed and truly benefit the region, it was critical to engage the community from the beginning and allow their input to inform the process.”
The Open Space Institute’s (OSI) community survey, built in ArcGIS Survey123, was live for three months during summer 2024 and was completed by more than 1,100 respondents.
About half of the corridor is already in recreational use, but there are gaps spanning many municipalities. With a desire to involve local residents and groups in the planning process, OSI knew they could not solely rely on traditional methods of community engagement such as distributing flyers, hosting open houses, and attending events like fairs and festivals.
Instead, OSI used ArcGIS Experience Builder, ArcGIS Instant Apps, and ArcGIS Survey123 to modernize its outreach efforts to connect with as many people as possible. Staff at the organization created maps and surveys to coordinate with residents, local communities, businesses, government agencies, and environmental experts across the Hudson Valley.
Using GIS to Modernize Community Engagement Efforts
“At the start of this [project], we knew there was going to be a public survey, we knew there would be direct community input on the routing alternatives, and all of it would need to be put on a map,” said Julia Feller, senior GIS associate at OSI. “We wanted something easy to build, maintain, and update.”
With Esri partner Greenman-Pedersen, Inc. (GPI), an engineering consulting firm, OSI staff initiated a feasibility study, known as the O&W Rail Trail Corridor Study. Their aim was to fully involve local communities in developing a plan for the entire trail corridor, including ways to improve existing trail conditions, site access routes and trailheads, and connect to amenities like restaurants, museums, farmer’s markets, and historical locations.
OSI’s GIS staff started with ArcGIS Experience Builder—a no-code, customizable app builder—to create a website featuring details about open houses and community events, frequently asked questions, information about the trails, and project resources. The site also contains interactive maps that show historical trail conditions and encourage public input.
The website created with ArcGIS Experience Builder contains interactive maps that show key locations.
“Experience Builder was a central part of this project,” said Feller. “We wanted something simple and user-friendly for people accessing this at home or on their phone.”
As the project progressed, OSI and GPI staff developed trail routing alternatives as shapefiles, which the OSI team then integrated into ArcGIS Instant Apps. This intuitive mapping app—which has easy-to-use templates and configuration options for web app development—makes it easier for audiences to engage with interactive maps and data and provide input by reading about trail alternatives and entering a thumbs-up or thumbs-down.
“We have something that is living and breathing,” continued Feller. “We were able to split [the map] up by where people live, because people know their own neighborhood and are able to provide feedback on their own community.”
Mapping Apps Will Help Shape a Connected Trail System
The first phase of the community engagement process used ArcGIS Survey123 to build and circulate a survey regarding the trail corridor. During OSI’s community survey, the app let residents and other stakeholders answer questions about how they use the current trail system and what they would like to see from a potential connected trail.
“Our team members were able to go in and look at the survey results as they came in,” said Feller. “We also translated the whole survey into Spanish using the beta translation feature, which saved a lot of time and made the survey accessible to a wider range of people.”
The OSI team found success in leveraging GIS to modernize its approach to community engagement. The online survey was live for three months during summer 2024 and was completed by more than 1,100 respondents. Happily, OSI learned that more than 98 percent of survey takers supported the O&W trail revitalization.
The home page of the O&W Rail Trail Corridor Study was created using ArcGIS Experience Builder.
OSI knows that the trail build-out won’t happen quickly; a greenway corridor conversion is a multiyear project. But with GIS, staff have the tools in place to gather input and provide updates to the community.
“Experience Builder allows us to gather, maintain, and share data—both spatial and nonspatial—in a single, easily accessible online space,” said Neil Jordan, director of geospatial strategy at OSI. “We’ve found this to be an effective tool for efficiently communicating a significant amount of information, both internally and externally.”
In the future, OSI staff plan to use GIS to support their efforts in maintaining a strong network of community leaders along the O&W corridor and to generate donations for greenway projects. Feller emphasized the value of the organization’s new website as a powerful tool for building engagement and educating people about the work they are doing.
“We will continue to share the website in our communities so that people can see active projects and stay up to date as the Growing Greenways initiative progresses,” she said.